
We Published A Research Paper! A Study on the Geographical Patterns of Adult Cochlear Implant Incidences
Here at Polaris, we pride ourselves in providing our clients the most granular geographic data possible. Modelling our data based on different geographic levels, such as postal code or CMA, allows our clients to gain more than just a big picture of their customer base, but a more refined and accurate representation of who the consumer is and where they are coming from.
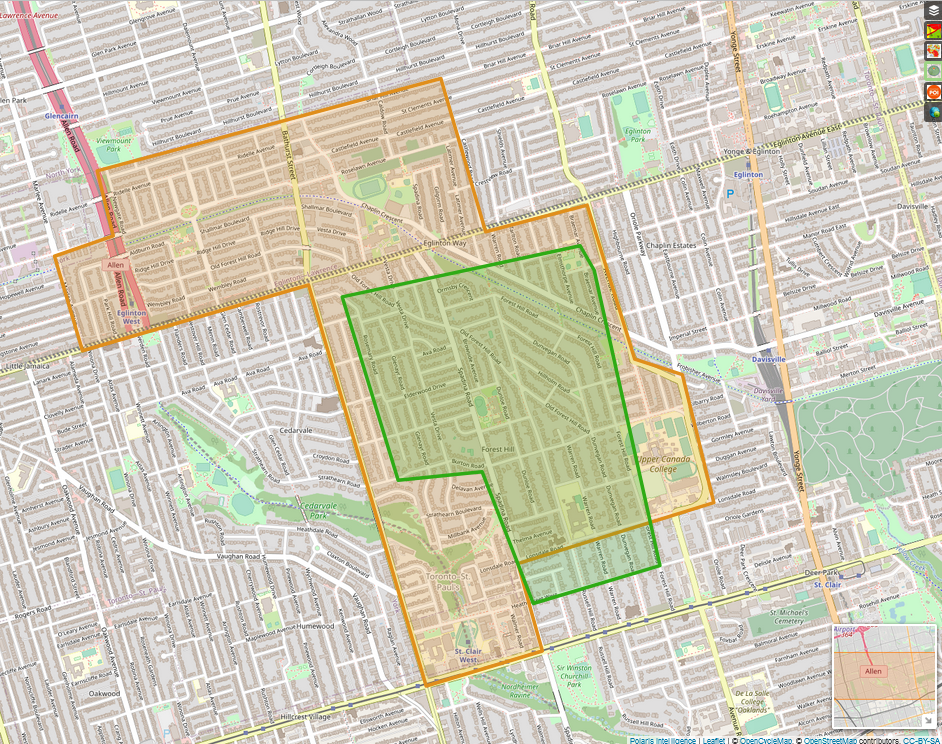
The orange polygon is Toronto’s Forest Hill neighbourhood, which includes apartment dwellers on Bathurst, Avenue, St. Clair, and Eglinton. On Eglinton, you even have Toronto Community Housing. When you zoom into the centre, the green polygon is “true” Forest Hill. The people in the green box mostly live in single detached houses. There are 6x less people living in the green area than the orange. Dwelling values in the green box is more than 2x the dwelling value of the orange polygon. Average household income of the green box is 3x the average household income of the orange area. The apartment buildings and lower income housing are right around the corner from the extremely affluent neighbourhoods.
Not only do our clients see the benefits of this, but so do some of Canada’s biggest research facilities. This is why, in collaboration with UBC and Sunnybrook Hospital, we have published a paper in the Journal of Otology & Neurotology on the sociodemographic factors affecting cochlear implantation, based on spatial and geographic location.
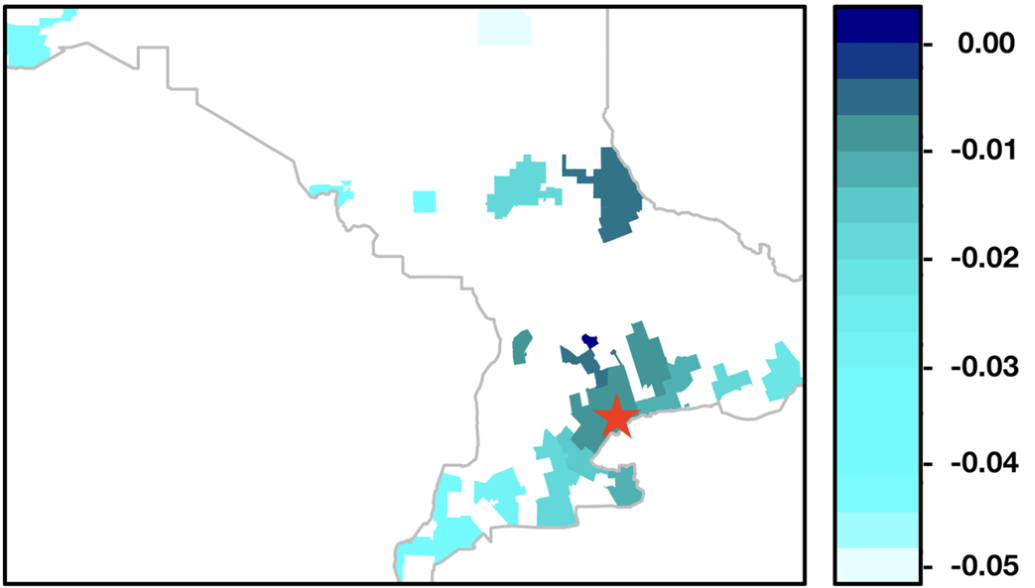
Incidence of adult cochlear implantation across census metropolitan areas (CMAs) in Ontario, Canada. The cochlear implant centre in this study is indicated by a red star. The incidence of adult cochlear implantation for each CMA per 100,000 persons was calculated and displayed on a map of Ontario, Canada. Lighter blue colours indicate smaller indices, and darker blue colours indicate greater indices.
Despite the increasing recognition of the health and socioeconomic consequences of untreated hearing loss, the utilization of cochlear implants (CI) remains low globally. Even in Canada, where healthcare is universal and most essential services and procedures are publicly funded, access to cochlear implants is hindered primarily by sociodemographic disparities. Members of our Manifold team, in collaboration with the Principal Investigators at Sunnybrook, conducted an understudied and much needed research on the distribution of adult CIs in relation to sociodemographic factors in various regions of Ontario. This study aimed to shed light on the underexplored relationship between sociodemographics and CI access in Canada.
With the help of our webapp, Polaris Intelligence, researchers were able to model historical and projected geographic and sociodemographic statistics. This comprehensive analysis provided valuable insights into various factors such as household size, age, income, education level and distance to CI centres by CMAs (Census Metropolitan Area). Through this more granular analysis, the results revealed that there was some local variation in the relationship between cochlear implantation and sociodemographic factor. Surprisingly, the findings challenge common expectations, however, the relationship may not be what you would think!
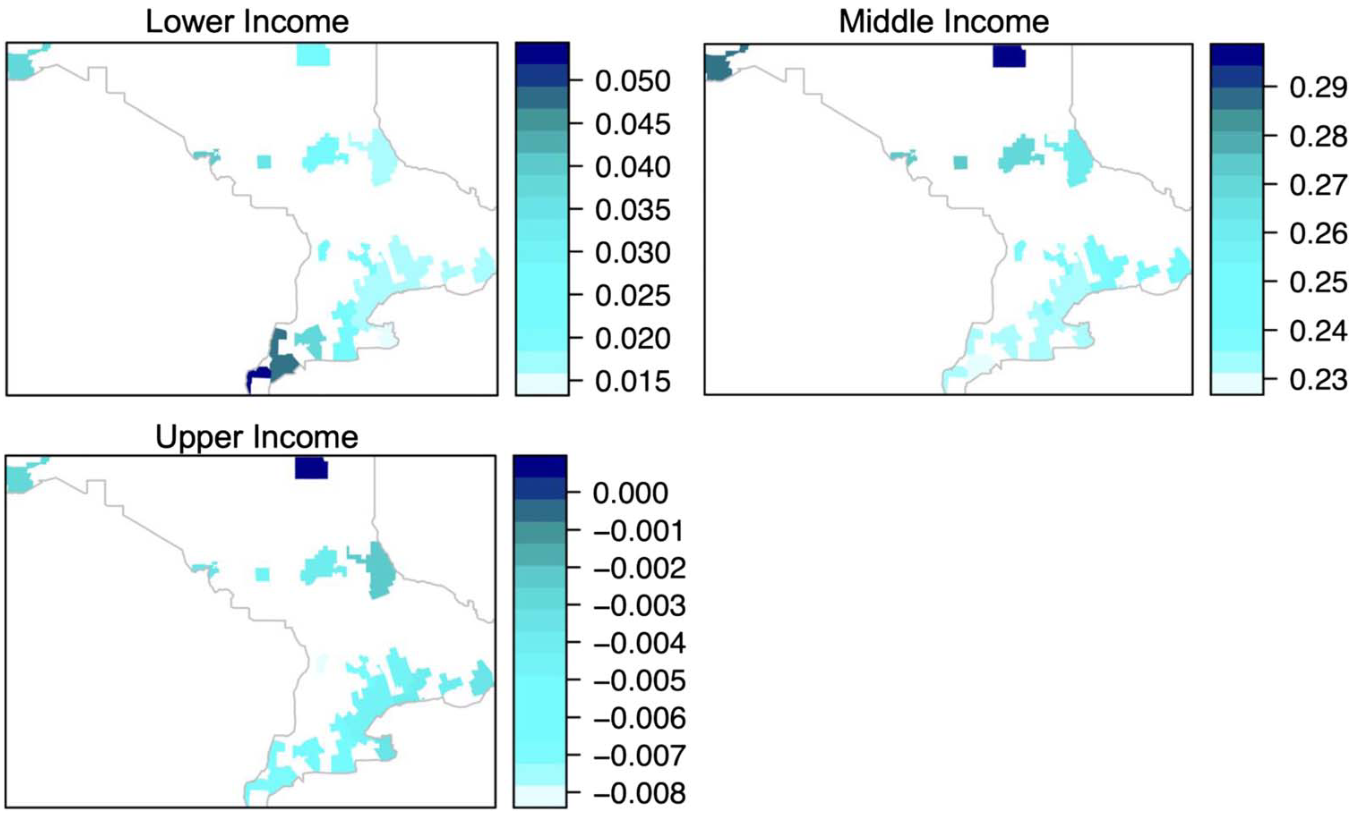
Spatial distribution of cochlear implants by income levels for each census metropolitan area (CMA) in Ontario, Canada, as computed by geographically weighted Poisson regression. The cochlear implant centre in this study is indicated by a red star. Light blue colours indicate smaller coefficients (increased likelihood of receiving a cochlear implant), and darker blue colours indicate greater coefficients (decreased likelihood of receiving a cochlear implant).
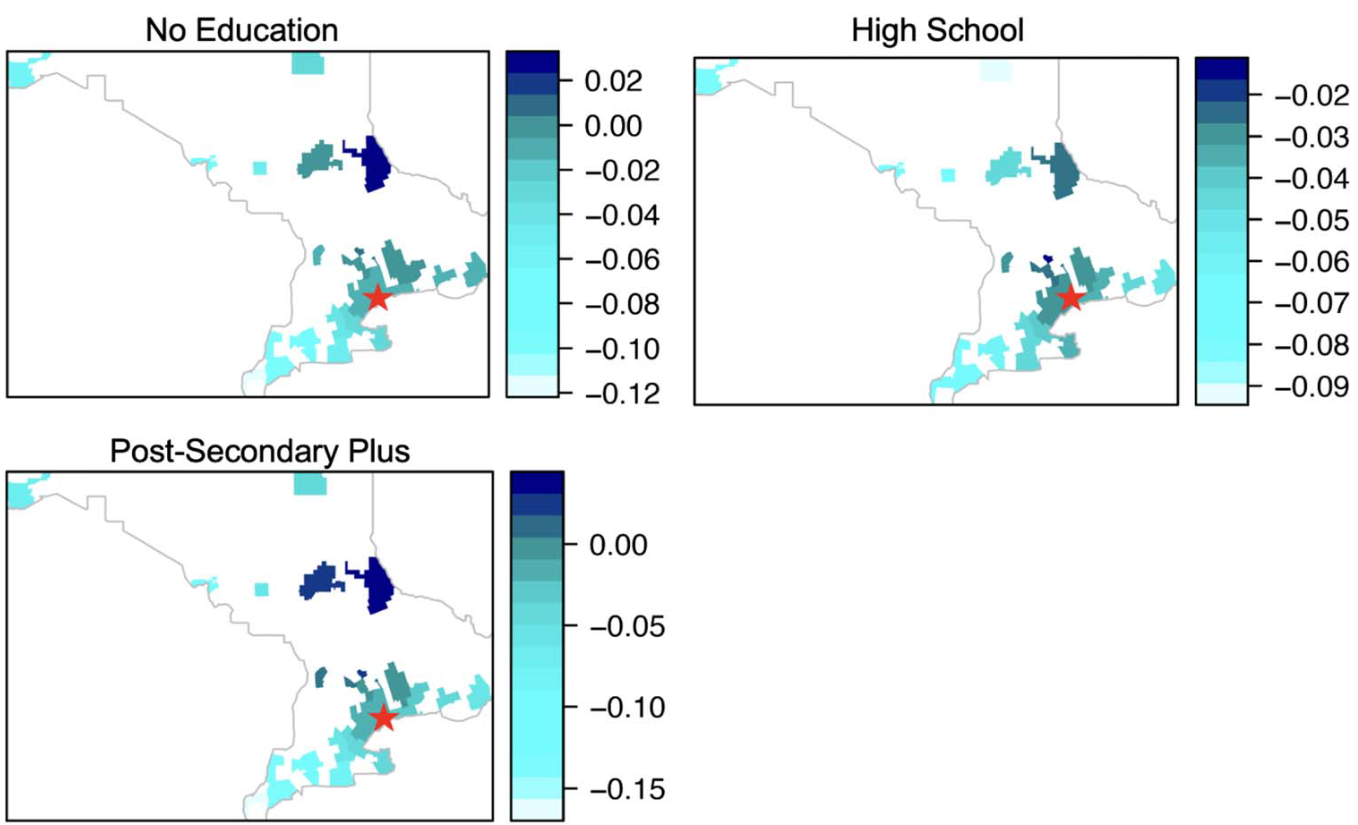
Spatial distribution of cochlear implants by education attainment for each census metropolitan area (CMA) in Ontario, Canada, as computed by geographically weighted Poisson regression. The cochlear implant centre in this study is indicated by a red star. Light blue colours indicate smaller coefficients (increased likelihood of receiving a cochlear implant), and darker blue colours indicate greater coefficients (decreased likelihood of receiving a cochlear implant).
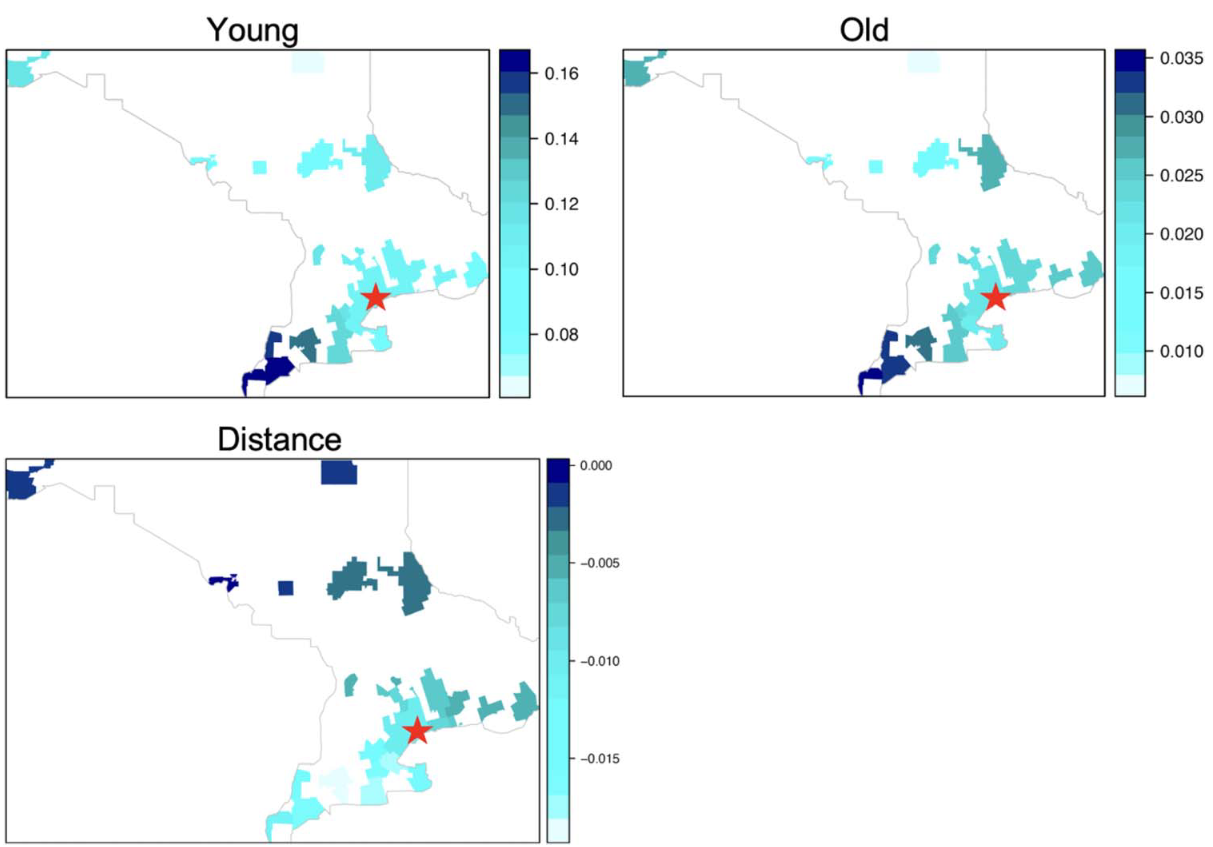
Spatial distribution of cochlear implants (CIs) by age at implantation and distance to CI centre for each census metropolitan area (CMA) in Ontario, Canada, as computed by geographically weighted Poisson regression. The CI centre in this study is indicated by a red star. Light blue colours indicate smaller coefficients (increased likelihood of receiving a CI) and darker blue colours indicate greater coefficients (decreased likelihood).
If you would like to know more, read the paper at this link!