The Primacy Truth: How Big Cities Rule Canada Use Polaris Data to Uncover Real Regional Opportunities and Outsmart the Map.
In Thailand, a single city holds the majority of the country’s wealth, talent, and infrastructure. Bangkok is home to roughly 25% of Thailand’s population. It is important to note that Bangkok is 285x bigger than Thailand’s second-largest city, Hat Yai. Geographers refer to this extreme imbalance as the ‘Bangkok Syndrome’.
To quantify this lopsided distribution, Mark Jefferson, a geographer, introduced a metric called the Primacy Ratio. To find this ratio, divide the population of a country’s largest city by its second-largest. This number reveals the concentration of population and economic activity within a country.
The National Primacy Illusion
At a macro level, Canada looks immune to Bangkok Syndrome. Consider our national primacy ratio:
- Canada (National): 1.55 (Toronto / Montreal)
As a result, it appears that power and economic engines are reasonably distributed throughout the country.
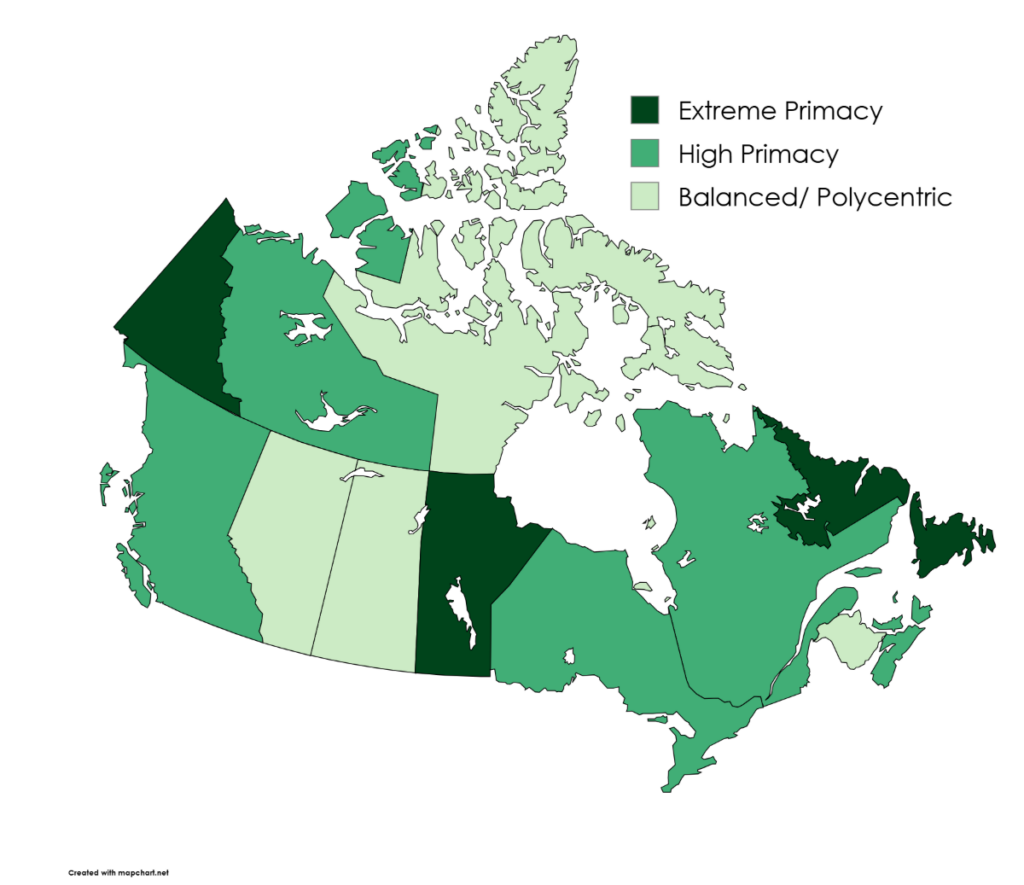
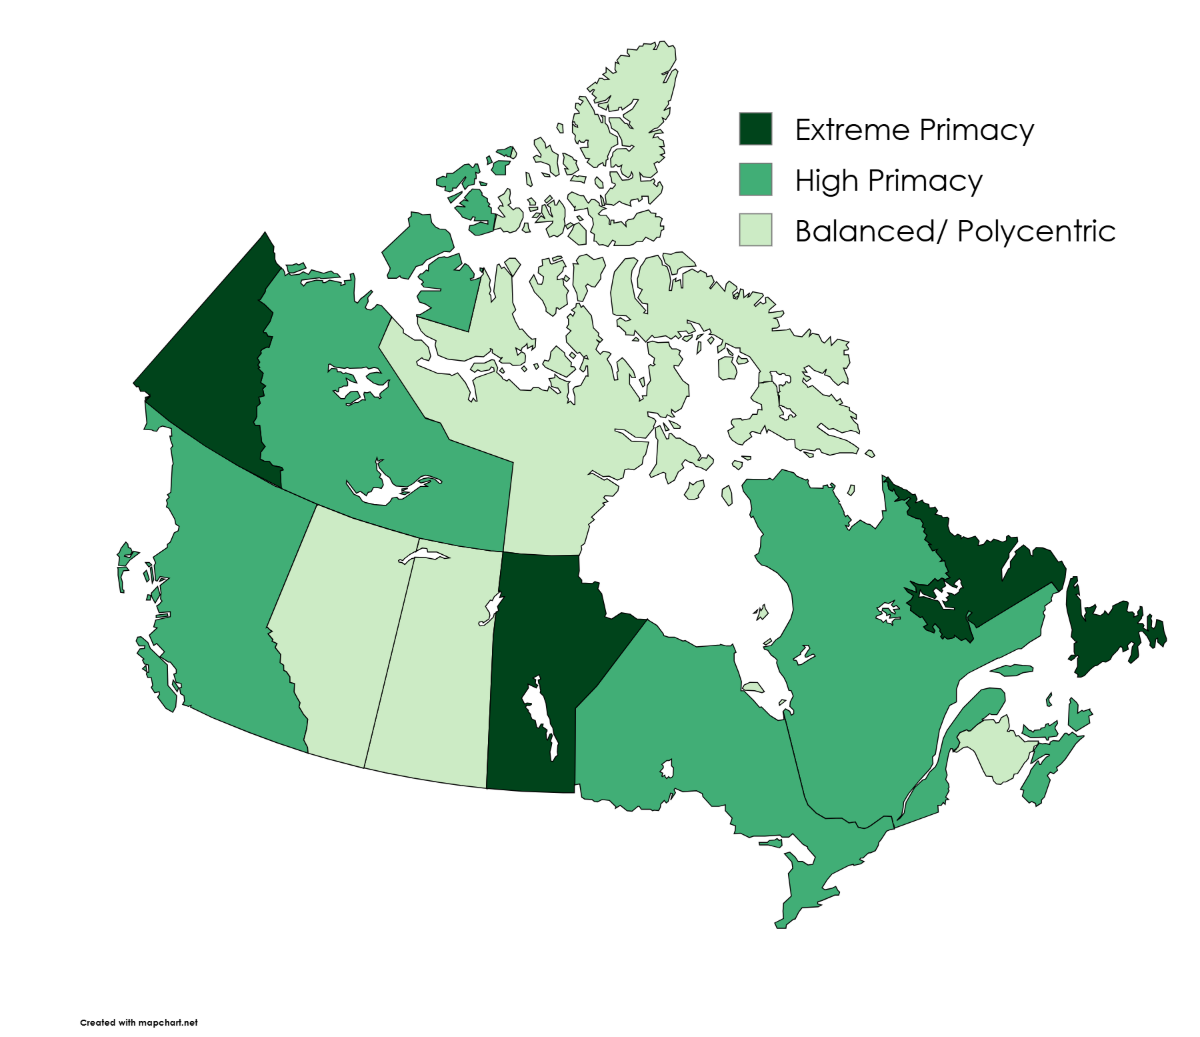
However, we decided to look at Canada through a provincial lens instead. Utilizing granular geographic datasets from Polaris Intelligence, we discovered these numbers tell an entirely different story. The true urban-rural primacy dynamics actually play out within our provincial borders. When looking at each province individually, a deep unbalanced picture comes to light.
High Primacy in the Powerhouse Provinces
British Columbia, Quebec, and Ontario are Canada’s economic engines. These provinces host major secondary cities like Ottawa, Quebec City, and Victoria. Despite the size and overall population of these cities, the primacy ratio remains remarkably high.
- British Columbia: 6.94 Vancouver/Victoria)
- Quebec: 5.33 (Montreal/Quebec City)
- Ontario: 4.31 (Toronto/Ottawa–Gatineau)
- Nova Scotia: 5.35 (Halifax / Cape Breton)
Take British Columbia for example. Victoria is a culturally rich capital city, yet Vancouver’s population completely dwarfs it. Vancouver is Canada’s massive Pacific gateway and has nearly seven times more residents than the provincial capital.
A similar imbalance plays out in Quebec. Quebec City is packed with European charm and a collection of 17th-century historic sites. Many describe Quebec City as Canada’s open-air museum and holds all provincial legislative power. Despite this, Montreal outscales it by over 5 times. Montreal operates as the true economic powerhouse of Quebec. It soaks up all the jobs, money, and young talent.
Ontario is also a good showcase of this urban concentration. Ottawa is our sprawling national capital, and houses massive federal infrastructure for our country. Yet, Toronto still outscales Ottawa by more than 4 times. Toronto functions as the hyper-dominant financial core that shapes the entire province.
Perfect Primacy Balance
Not all Canadian provinces suffer from this intense centralization. In fact, there are a few provinces who have an incredibly even split of power. These balanced, multi-centered regions are referred to as polycentric. Consider the following:
- Alberta: 1.05 (Calgary / Edmonton)
- Saskatchewan: 1.32 (Saskatoon / Regina)
- New Brunswick: 1.30 (Moncton / Saint John)
Alberta is Canada’s champion when it comes to geographic balance. Calgary and Edmonton are pretty much a demographic tie. This even distribution has shaped how regional identity and economic influences are divided.
Because power splits right down the middle and neither city dominates the province, a more balance distribution of influence is created. For example, if they are angry at politicians, they look toward Edmonton. On the other hand, if they are frustrated with corporate oil towers, they look toward Calgary. Therefore, this regional friction naturally diffuses.
Small-Scale Primacy and Scale Illusions
Prince Edward Island experiences a similar thing, but with a twist. Similarly, Canada’s northern territories have massive ratios. Consider these unique metrics:
- Prince Edward Island: 4.41 (Charlottetown / Summerside)
- Yukon: 20.25 (Whitehorse / Dawson City)
- Northwest Territories: 7.05 (Yellowknife / Hay River)
Charlottetown signals heavy centralization against Summerside. However, this is referred to as “small-scale primacy” because the populations of these two cities are small. Charlottetown is home to less than 100,000 people. While it has the biggest population, it’s still considered a small town on a national level.
Up north, Whitehorse holds almost the entire territory’s population, while Dawson City’s population remains small. This dramatic spike represents an illusion of scale rather than Bangkok Syndrome. With such a small population base, small communities like Dawson City can heavily impact the results. As a result, Whitehorse may appear disproportionately dominant, despite being a relatively small northern city.
Why the Provincial Scales Tilted
So, how did Canada’s urban landscape become so uneven? The answer comes from a mix of corporate history, geography, and how early settlers built our railway systems. Consider the following regions where extreme primacy took over:
- Manitoba: 15.62 (Winnipeg / Brandon)
- Newfoundland and Labrador: 7.62 (St. John’s / Corner Brook)
In these provinces, geography and historical development concentrated population growth into one major city. Many major transportation routes, trade connections, and businesses became concentrated around Winnipeg’s rail network. Over time, this created a massive snowball effect. This big city kept absorbing all new jobs and investments, and barely left anything for the secondary cities.
The balanced provinces, however, had completely different setups from the very beginning. For example, Alberta naturally grew around two industries located in two different regions. Edmonton became the northern political hub and oil pipeline gateway, and Calgary became the southern corporate headquarters and ranching center. Neither city could manage without the other. They were never competing forces either, because they held completely different economic superpowers.
The Future of the Primacy Gap
These historic provincial divides play a role in actively shaping Canada’s future. As Canada welcomes hundreds of thousands of newcomers each year, these provincial imbalances will likely get even worse. New immigrants tend to gravitate toward hyper-dominant hubs like Toronto, Vancouver, and Winnipeg because that is where the initial job networks and established communities already are.
As a consequence, this relentless growth creates a severe compounding effect. These massive cities keep absorbing all of the economic capital, driving real estate prices through the roof and straining local infrastructure. Meanwhile, incredible secondary cities struggle to attract the workforce they so desperately need for growth.
Unless provincial governments actively incentivize corporate investment and housing development in secondary hubs, these disbalances could become a permanent economic crisis. Our dominant cities will keep getting more and more expensive, while the rest of the country struggle to capture similar growth opportunities.
Redefining the Canadian Map
Judging Canada’s urban landscape by one single national number completely misses the reality. The traditional assumption that our wealth and population are spread evenly is merely an illusion.
When we look past the federal averages, we see a country of massive regional contrasts. Some Canadians live in perfect balance, like in Calgary and Edmonton, while some navigate imbalanced provinces dominated by one major city. Recognizing these internal imbalances is the first step toward truly understanding Canadian politics, economy, and culture.
Turn Geodemographic Data into Action
For businesses, developers, and marketers, navigating this lopsided landscape requires more than just high-level guesswork. You need to recognize the hyper-dominant hubs and rising secondary markets. You also need to consider how these markets spend, live, and what they need.
This is where precision analytics comes into play. With Manifold Data Mining, you can look past basic census data and access six-digit postal code insights on consumer behaviour and spending patterns.
Ready to visualize these trends on a map and target your true audience? Fire up Polaris Intelligence to run advanced trade area analyses and build custom profiles for your markets. Don’t let geographic illusions dictate your growth strategy. Instead, let real data guide your next move.
The Complete Provincial Dataset
| Province / Territory | Largest City (CMA/CA) | Population | Second Largest City (CMA/CA) | Population | Primacy Ratio |
| Yukon | Whitehorse | 37,598 | Dawson City | 1,857 | 20.25 |
| Manitoba | Winnipeg | 985,517 | Brandon | 63,076 | 15.62 |
| Newfoundland & Labrador | St. John’s | 231,713 | Corner Brook | 30,399 | 7.62 |
| Northwest Territories | Yellowknife | 23,629 | Hay River | 3,354 | 7.05 |
| British Columbia | Vancouver | 3,148,112 | Victoria | 453,446 | 6.94 |
| Nova Scotia | Halifax | 551,767 | Cape Breton | 103,223 | 5.35 |
| Quebec | Montreal | 4,806,418 | Quebec City | 901,237 | 5.33 |
| Prince Edward Island | Charlottetown | 94,119 | Summerside | 21,340 | 4.41 |
| Ontario | Toronto | 7,468,384 | Ottawa-Gatineau | 1,734,247 | 4.31 |
| Saskatchewan | Saskatoon | 378,899 | Regina | 287,285 | 1.32 |
| New Brunswick | Moncton | 185,396 | Saint John | 142,743 | 1.30 |
| Alberta | Calgary | 1,767,122 | Edmonton | 1,680,338 | 1.05 |
 Powered by