
Why data is essential in reaching your demographic on social media How to leverage consumer data to increase ROI
The world of marketing has changed following the emergence of social media. Facebook has nearly 3 billion active users as of Q2 of 2022, Instagram cited 1.21 billion monthly active users as an average for 2021 and TikTok had 1.2 billion active monthly users by Q4 2021. Smaller social media networks like Snapchat, BeReal, Pinterest and Reddit also have a strong market share in attracting consistent users to their platforms. 85% of Canadians have accessed the internet over the past 24 hours.
So how do you effectively target these users to optimize your marketing efforts and increase your ROI?
To answer this question, we will walk through a real-life case study in which Manifold’s data and the Polaris web app were used to drastically improve the results of a company’s social media marketing campaigns.
Introduction
A weight-loss clinic was using Facebook ads to acquire new patients. However, they found that the ads were not returning enough to justify the cost.
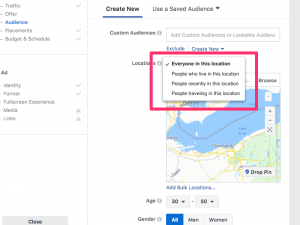
The way the Meta advertising toolkit (Facebook, Instagram and other Meta socials) works is by allowing users to highlight a radius, and then input some data to narrow down to their demographic. Users can specify age, gender and what types of people in the area (live-in, recently in, traveling) they want to target. They can also input keywords that may make the ad appear more often on the right users’ social media feeds. For example, the clinic might specify ‘health’ as a keyword, making their advertisement more likely to appear to users who engage with content that has similar keywords.
How Polaris Fits In
The problem with running ads while only utilizing the Meta Toolkit is that it lacks the sophistication to be able to filter by income or propensity for spending on specific sectors. In the case of the weight-loss clinic, they were not able to effectively target those who were most likely to spend on personal health care. Meta charges by the impression (the number of times your ad is shown on a user’s page), not the result, so targeting uninterested leads on their platforms results in inflated marketing costs.
We worked with the clinic to reduce ad spending on uninterested prospects and raise engagement. The ultimate goal was to increase conversion rates from leads generated on Facebook.
Using our targeting algorithms and spatial analysis, we identified key neighbourhoods, specific 6-character postal codes with the highest spending on weight loss products and annual incomes greater than $150,000. Once the top 6-digit postal codes were identified, the top FSAs (first 3-digits of the top postal codes) were uploaded onto Facebook so that only those specific areas were targeted with relevant ads.
The Results
By targeting the top FSAs that our data products identified, the clinic reduced their spending on Facebook ads. Meta charges by the impression, not the result, so targeting uninterested leads on their platforms results in inflated marketing costs.
The clinic saw a 306% increase in Facebook user click-throughs on their ads and a 140% increase in calls booked. This resulted in a 244% increase in revenue for their business.
So it worked for this clinic… Why should I be convinced it will work for me?
Imagine you’re the general of an army. You know you’ve put in the work to train your troops well and are confident in their ability. You’re marching towards battle but there are a few unknowns: 1) You don’t know who you’re fighting. You don’t know how many soldiers they have, what weaponry they possess, or how they think. 2) You don’t know where you’re fighting. Your soldiers will keep marching until they reach the battle. Will it be in a field, amongst hills, rivers, or marsh? If you knew these variables you would be able to execute your battle plan much more effectively.
Excuse the dramatic metaphor but the same applies to marketing. Having Manifold’s data on your side allows you to use specific variables to define your best consumers. You can create your target segment from any combination of our 20,000+ variables on Polaris. Then Polaris will help you locate your target segment and visualize that data with customizable heatmaps. Our current-year data gives you insight into your prospective consumers’ physical and digital footprint so that you can have the full ‘battle-map’ and move forward with confidence.
If you have any specific questions, or would like to set up a meeting to discuss how we can support you, please visit our Contact Us page.