COVID Risk Score Predictive Analytics for Retail, Healthcare, and Insurance
COVID Risk Score
It is November 20, 2020 as we write this, and each day brings a new record in the number of confirmed new COVID cases in Canada. Experts say that until 85% of the population is vaccinated, community transmission of COVID will still continue in Canada. That means COVID will likely continue to affect Canadians throughout most of 2021.
If you are a retailer, you have already made plans to allocate resources and prepare for different COVID scenarios. You know that on any given day, there is a chance that your employees at one location could be infected, or there may be many infected customers in your store, which could require you to shut down that location for deep cleaning. You also know that your stores in some regions are more likely than others to experience the worst case scenarios.
Provincial and Municipal governments release COVID statistics, but they all use different definitions, have different reporting intervals, and different levels of geographic granularity, which means it can be difficult to make decisions on allocating resources and preparing for outbreaks based on their data.
How can you prepare better for COVID?
Since March 2020, each phase of COVID has infected different groups of people and as time goes on, the main groups of people who are infected will change. In the first phase of approximately March through June, seniors, particularly those in retirement homes and long-term care facilities were hardest hit. In the second phase, June through September, those who were socializing in clubs and restaurants comprised most of the new cases. More recently, those who are unable to work from home, have low income, are visible minorities, along with a few other characteristics, have been the primary groups who have been infected.
Using Polaris, we can select those key risk factors (low-income, certain visible minorities, unable to work from home, and a few others) and create a COVID Risk Score for all the residential postal codes in Canada. You can identify where these key risk groups are concentrated in any market across Canada (we’ll use Toronto, Vancouver, and Montreal as examples).
TORONTO
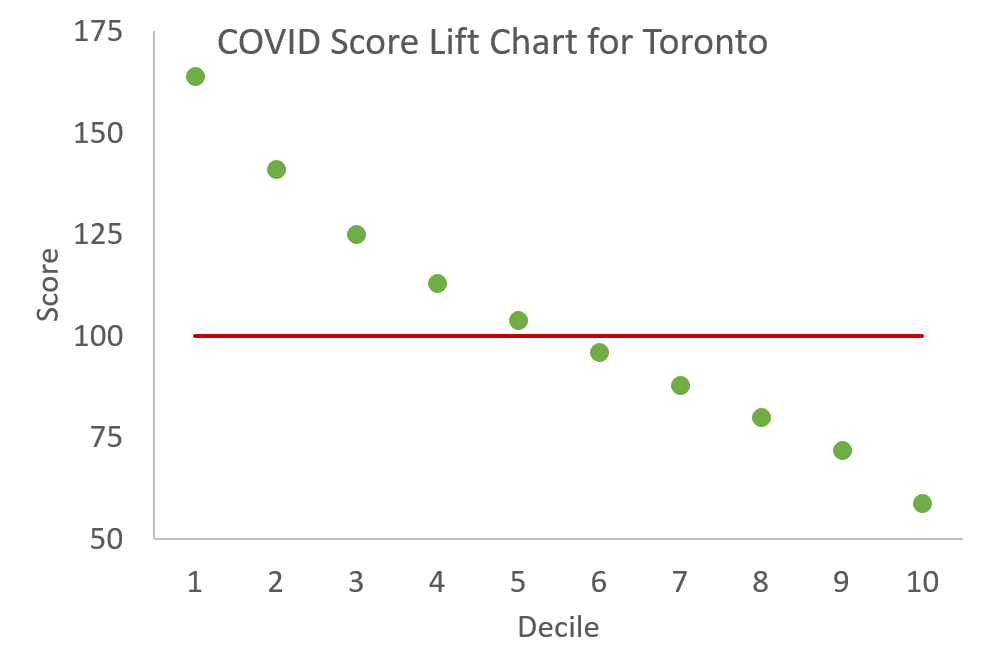
One of the most important things in predictive analytics is the Lift Chart. The Lift Chart tells you the improvement that a predictive model provides when compared against a random guess. Our Lift Chart for our COVID Risk Score for Toronto is below, and as you can see there is significant predictive power.
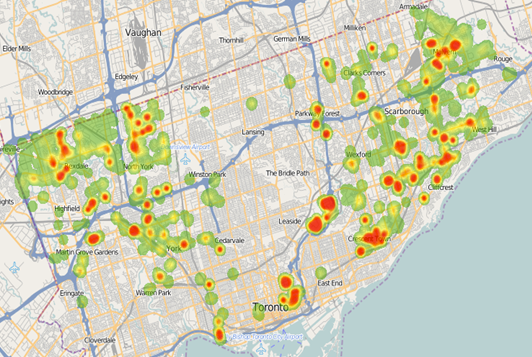
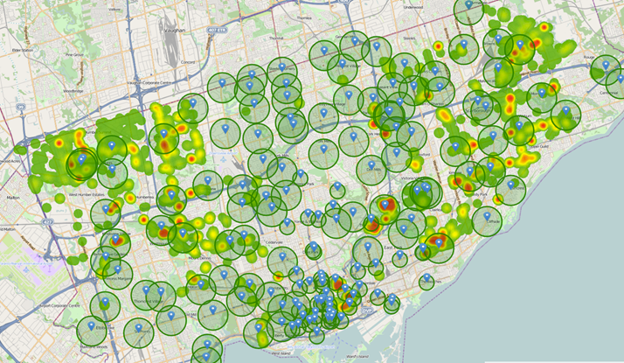
As you can see from the heatmap below (generated with scores at the 6-digit postal code level), we can clearly identify hotspots in Rexdale, Parkdale, Flemingdon Park, Thorncliffe Park, St. James Town, Crescent Town, Malvern in Toronto.
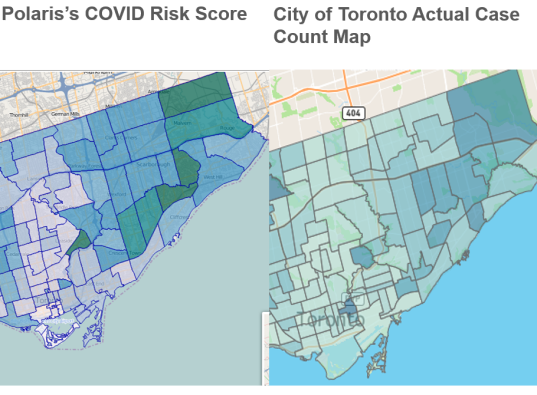
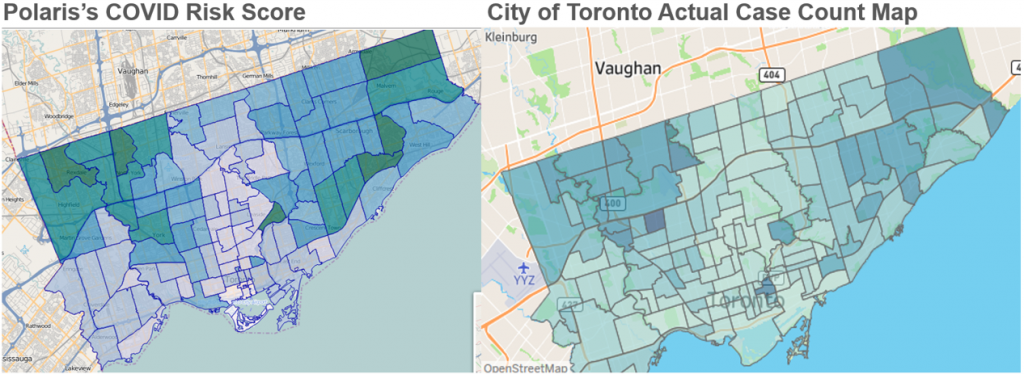
When we compare our COVID Risk score aggregated at the FSA level (Forward Sortation Area) to Toronto Public Health’s map of confirmed cases, we can see that our score matches their map of confirmed cases almost exactly.

VANCOUVER
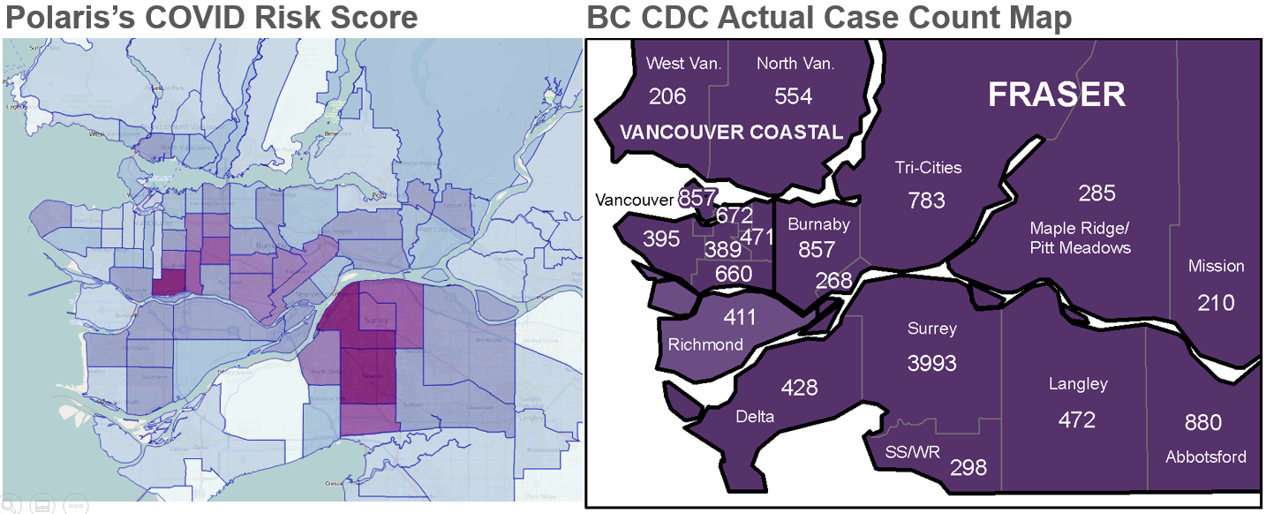
When we compare our COVID Risk Score at the FSA level to Vancouver’s map of confirmed cases, we can see that our score matches their map of confirmed cases very closely as well.
North Van, West Van, Richmond, Delta, UBC/West Point Grey have low case counts and low COVID Risk Scores. Surrey has particularly high case counts, which matches the Polaris COVID Risk Score, and Burnaby and South Vancouver also have high case counts, matching the Polaris COVID Risk Score.
MONTREAL
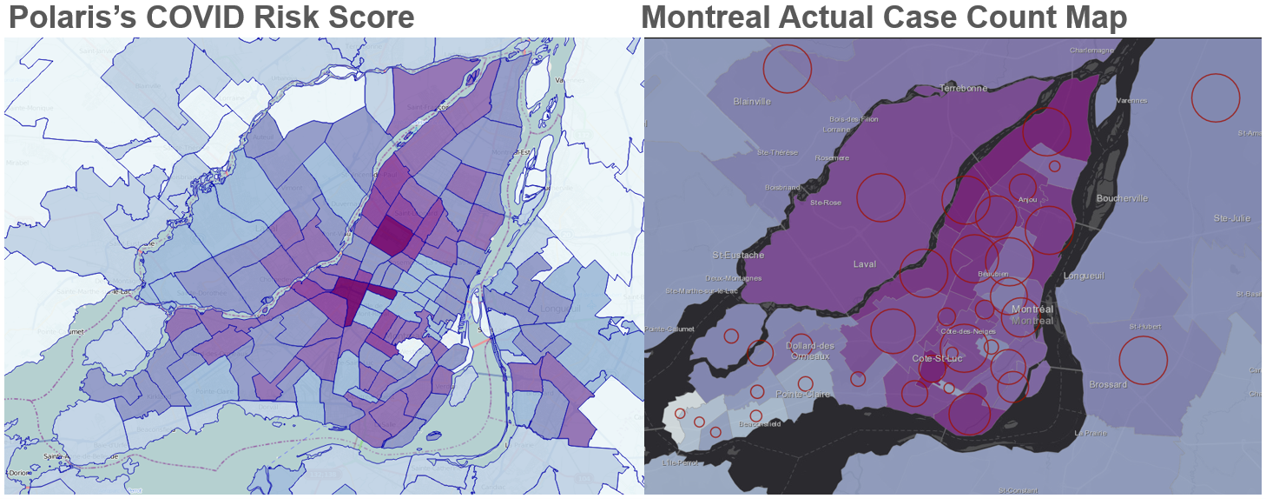
Our COVID Risk score at the FSA level in Montreal also closely resembles Montreal’s map of confirmed cases. Montréal-Nord, Lasalle, Côte Saint-Luc are the hardest-hit neighbourhoods, while Beaconsfield, Pointe-Claire, and the suburbs like Saint-Eustache are relatively lightly affected.
Takeaways
Imagine if you could use our heat maps to allocate resources and plan your COVID-preparedness plan for all your stores, branches, or locations across Canada? What would you do differently or change if you knew that 10 of your stores were in neighbourhoods that have extremely high COVID case counts while 90 of your stores are in neighbourhoods that are largely unaffected? Would you put up more signs in some areas? Would you encourage customers to visit other locations? Would you ensure that some locations had more cleaning stations/staff? Would you schedule shifts differently?
As the pandemic continues, risk factors and social determinants will change, and the Polaris COVID Risk Score will change with it.
Want to learn more? Want more recently updated COVID Risk Scores? Want to learn what household consumption patterns or media usage patterns are like in some of these hardest-hit areas or conversely, the lightest-hit areas?
N.B. All risk scores and risk factors calculated as of November 20, 2020.
