COVID-19 and Financial Wellness

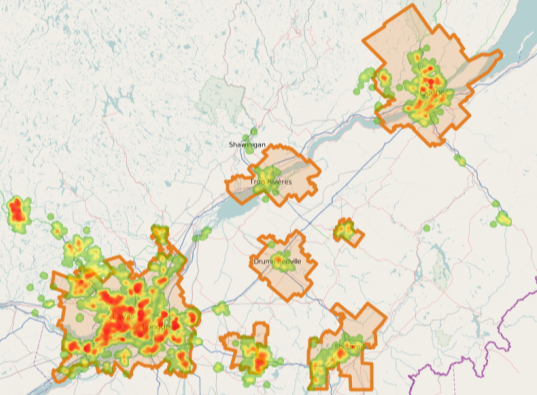
The province of Québec is leading Canada in terms of reopening its economy. What are some financial risks if household incomes in Québec don’t return to normal soon? Are there parallels to be drawn to the rest of Canada? Which areas are most impacted financially and what does this mean for Québec’s real estate market? We can create a simple potential mortgage default index in Polaris by multiplying the following variables: % Household income from employment, Average mortgage […]

Read More…

Zooming in on Market Insights: Why Do Postal Codes Matter?

Businesses and organizations looking to analyze their market and gain customer insight need to choose the geographic resolution of their statistical and demographic data. Any GIS analyst can tell you one geographic level of analysis may not be perfect for all questions, and there are many different options to choose from (CMA, CD, DA, FSA, Postal Code level, etc.). Many underestimate the value of postal code […]

Read More…

Release Notes May 4, 2020

The Mapping Centre, Trade Areas, POIs, sharing custom reports, and Data Mining saw a number of improvements this release. In the Mapping Centre, you can now save a picture of your map as a PNG through our new download map feature! When creating trade areas, you can now use latitude and longitude instead of postal code to define the centre or other points! All of your customized reports can now be shared with Polaris users in your group with the click of a button! […]

Read More…

COVID-19 Hotspots: Finding high risk populations using Polaris

COVID-19 is quickly spreading and impacting an alarming number of people that come from different walks of life. The demographics of confirmed cases indicate that some groups are much more vulnerable to the virus than others. How can we find the communities which are most at risk? Is the distribution of the most vulnerable groups to COVID-19 geographically even? We use Polaris to tackle these questions. […]

Read More…