Release Notes April 12, 2021

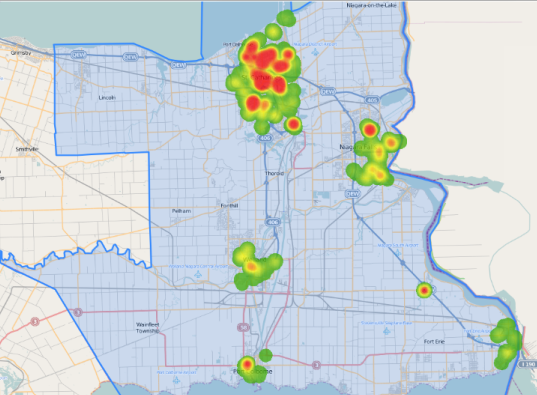
This release, we bring to you some new and helpful features into the Mapping Centre that offer more information and more flexibility in how users can present their mapping data, such as the option to un-cluster pins in Heat Maps and the ability to generate reports based on driving distance. Alongside this, we deliver some various enhancements throughout Polaris to help keep your user experience as smooth and intuitive as possible. […]

Read More…

Release Notes March 8, 2021

New features, enhancements, and an improved user experience-This release, we turned on features like the Data Mining module, made enhancements to custom POI pins, enabled sharing more fields within user groups, and modified the Customer Calendar in Weather Analysis to give more detailed results. We are continually adding features that make Polaris consistent throughout the whole web application. […]

Read More…

Release Notes February 1, 2021

This release, we loaded a new vintage of data onto Polaris, with statistics that reflect conditions after the start of COVID. This release also enables users to use custom POI pins, move POI labels, change the colour of POI labels, choose Gravity Model centrepoints from the map, sharing markets with user’s group members, and access the Numeris Scale document for those subscribed to Numeris reports! […]

Read More…

COVID-19 Hotspots: Finding high risk populations using Polaris

COVID-19 is quickly spreading and impacting an alarming number of people that come from different walks of life. The demographics of confirmed cases indicate that some groups are much more vulnerable to the virus than others. How can we find the communities which are most at risk? Is the distribution of the most vulnerable groups to COVID-19 geographically even? We use Polaris to tackle these questions. […]

Read More…