This release, we bring to you some new and helpful features into the Mapping Centre that offer more information and more flexibility in how users can present their mapping data, such as the option to un-cluster pins in Heat Maps and the ability to generate reports based on driving distance. Alongside this, we deliver some various enhancements throughout Polaris to help keep your user experience as smooth and intuitive as possible. […]
Tag: Heat Maps
Release Notes March 8, 2021
New features, enhancements, and an improved user experience-This release, we turned on features like the Data Mining module, made enhancements to custom POI pins, enabled sharing more fields within user groups, and modified the Customer Calendar in Weather Analysis to give more detailed results. We are continually adding features that make Polaris consistent throughout the whole web application. […]
Release Notes February 1, 2021
This release, we loaded a new vintage of data onto Polaris, with statistics that reflect conditions after the start of COVID. This release also enables users to use custom POI pins, move POI labels, change the colour of POI labels, choose Gravity Model centrepoints from the map, sharing markets with user’s group members, and access the Numeris Scale document for those subscribed to Numeris reports! […]
Release Notes January 11, 2021
This month’s release allows users to run Customer Profiling with Dissemination Areas (DAs), to import shapefiles into Polaris as Zone Files for Targeting, to hide Points of Interest (POIs) and POI Labels for individual points, to use a more sophisticated Gravity Model, and to download Customized Reports more quickly. We also enhanced the Feature Selection model and the User Interface. […]
Why Do Media Agencies Use Polaris Intelligence?
“What I love about Polaris is that I can take the persona from customer profiling or segmentation to messaging and the creative, to finding the right media channel in the right markets at the right times to reach the persona!” -Judy, top ad agency
“We used to just pick major markets, Toronto, Vancouver, Montreal. I […]
Release Notes November 30, 2020
This month’s release allows users to import shapefiles into Polaris, create new variables with two new transformations (Divide and Subtract) for the Targeting Module, and includes new data on cottages and area calculations (land area and inhabited area). We also improved the user experience by reducing load times in the Mapping Centre and making shapes more consistent. […]
COVID Risk Score
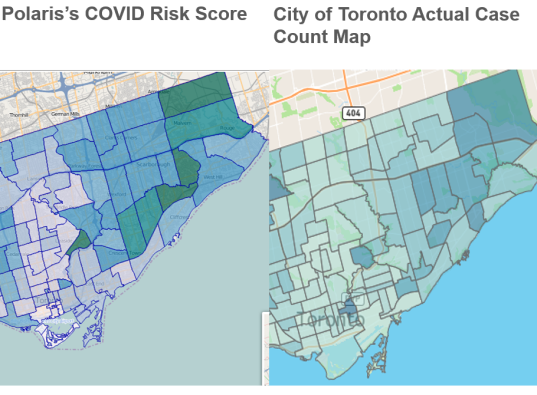
What would you do differently or change if you knew that 10 of your stores were in neighbourhoods that have extremely high COVID case counts while 90 of your stores are in neighbourhoods that are largely unaffected? You can use our heat maps to allocate resources and plan your COVID-preparedness plan for all your stores, branches, or locations across Canada. Since March 2020, each phase of COVID has infected different groups […]
Release Notes October 30, 2020
This month’s release includes new features like a Thematic Maps page, enabling KML file uploads, a user FAQ, sharing Customer Files, and bug fixes and enhancements. If you used Google Maps or a mapping/GIS software to create sales territories, custom regions, or other kinds of geographic shapes, you can import these shapes as Trade Areas on Polaris. The user FAQ is in the top-right corner, and can be found by clicking your user icon. […]